JACKSONVILLE, Fla. – The results of a University of North Florida study to map the hottest parts of Jacksonville were released Tuesday.
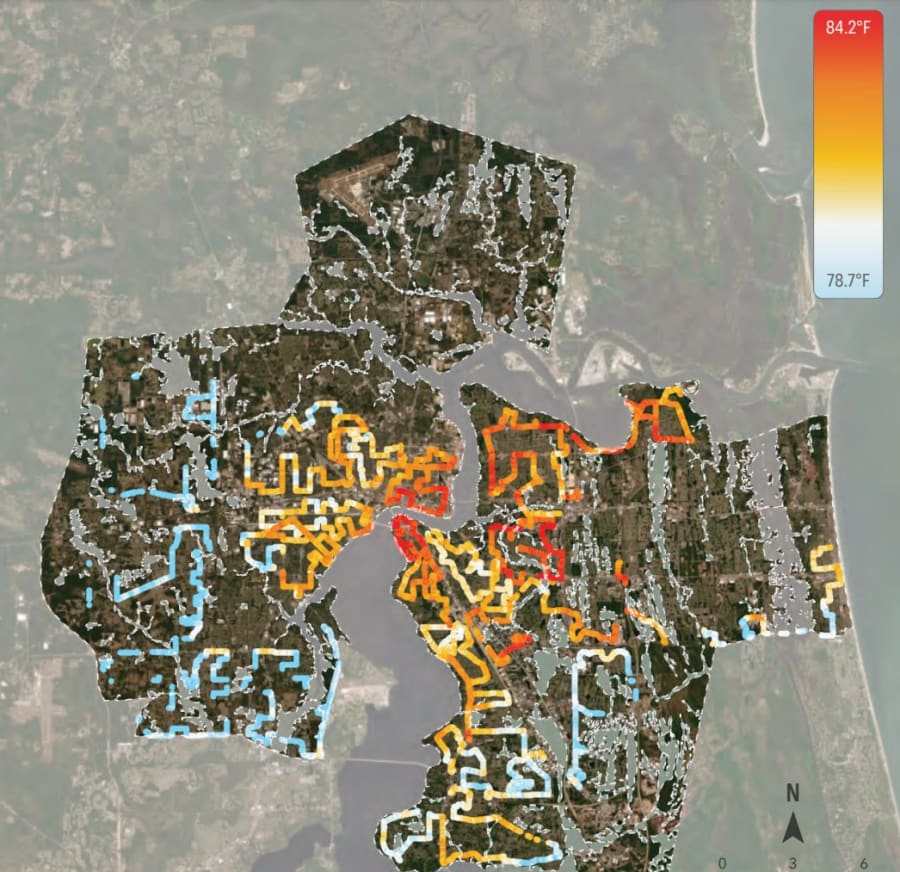
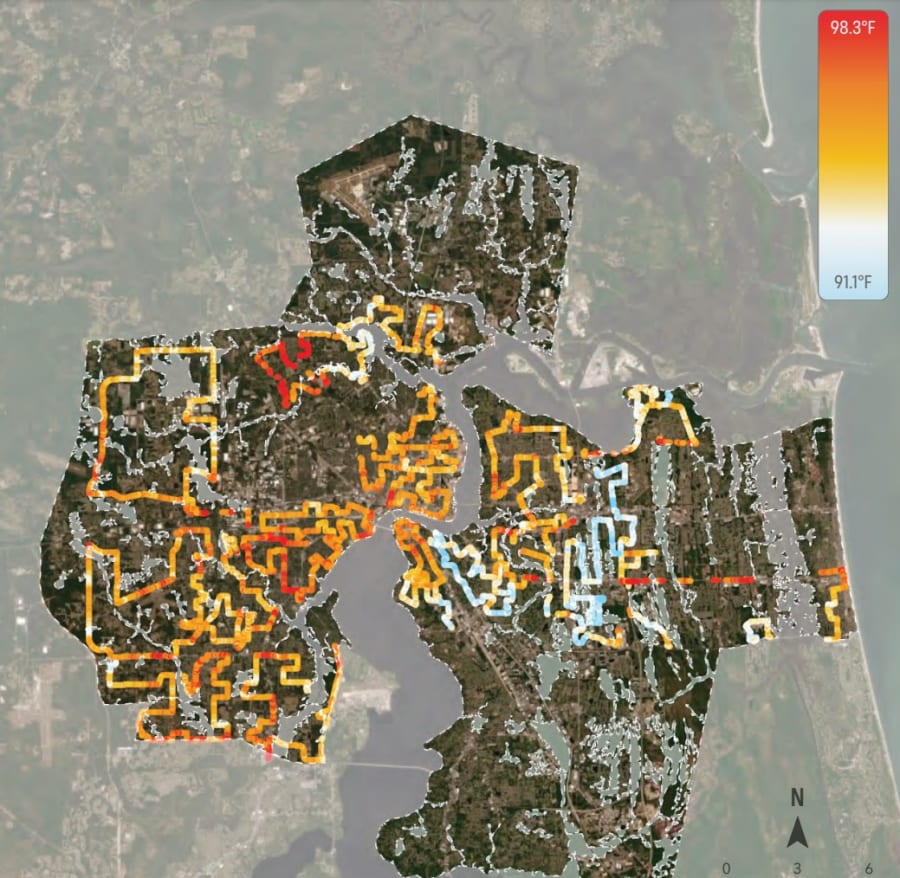
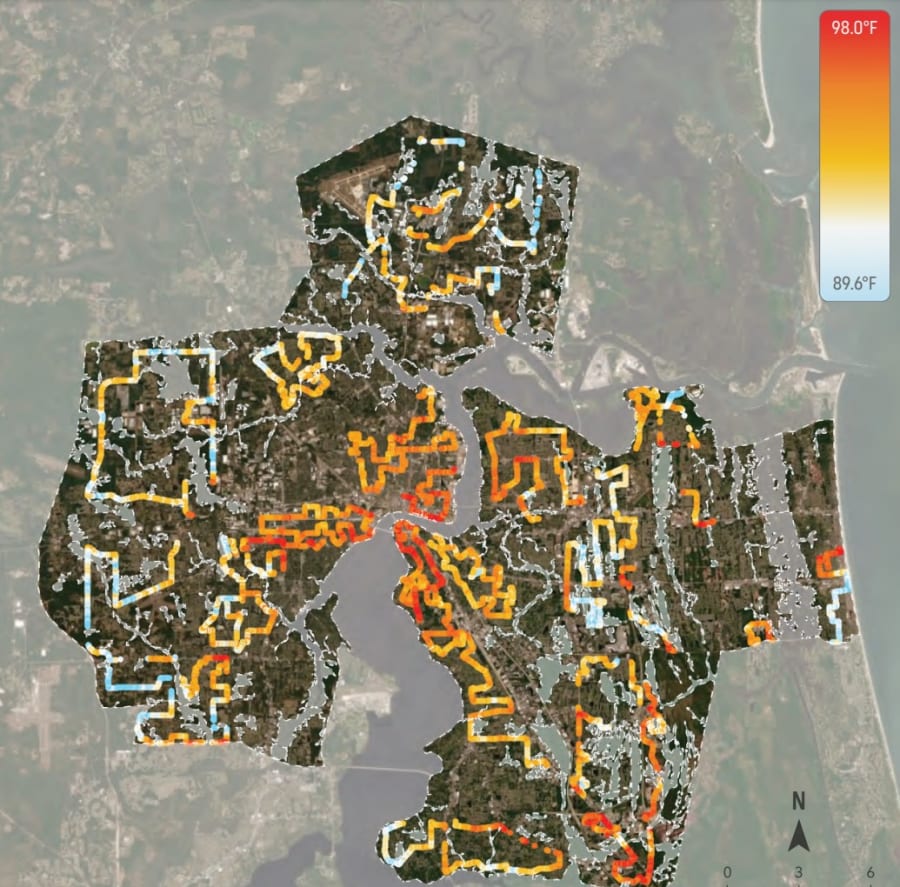
Researchers and volunteers drove over 400 miles measuring the temperature on 30 different routes through Duval County during a hot day on June 18.
Everyone knows the summer is hot in Jacksonville, but this variation may surprise you. The Heat Watch Report shows some places reached almost 95 degrees Fahrenheit in the hottest areas, while others varied by nearly 12 degrees throughout the county.
Some areas are much hotter than other parts of town because buildings and concrete absorb heat forming urban heat islands that can be dangerous to public health.
DOCUMENT: View the entire Heat Watch Report
The maps show some but not all of the hottest areas are in underserved communities without the financial means to keep up with climate change.
The hottest areas are in Talleyrand, San Marco, and several shopping centers, including the Gateway and St. Johns town centers, and along parts of Philips Highway. Jacksonville Mayor Lenny Curry says all the areas have one thing in common.
“So if it’s a highly commercial or industrialized, zoned area, that’s going to be incredibly hot, a lot of concrete, a lot of pavements,” Curry said. “Areas where there’s a lot of canopy, a lot of trees, it’s going to be cooler.”
A bright red spot over Gateway Town Center on the Northside reveals how parking lots and buildings can make this area hotter.
The natural area north of St. Johns Town Center along St. Johns Bluff Road seems to stay cool — which can also help break the heat in adjacent areas.
Street surveys were taken a three different times of the day, and they showed how temperatures stayed warmer through the night compared to regions away from urban regions. Without a break at night, the accumulated heat puts people at heightened risk of illness and death during extreme heat events.


Tightly packed homes in densely spaced neighborhoods like San Marco stay hotter, and the same example can be seen along Jacksonville Beach where streets are warmer north of Beach Boulevard compared to those below it with more spacing and an established tree canopy.
Curry says the Heat Watch Report provides his chief resiliency officer and staff with vital information about how to design infrastructure for future administrations
“What we can do with this is take areas, neighborhoods that we haven’t invested in over the years, over the decades, proper trees, and allocate budget dollars to make sure those areas are represented with these types of resources,” Curry said.
Moving forward, the City of Jacksonville plans to use the information to improve the worst areas impacted by heat. The new maps can be used to plan mitigation strategies to reduce the heat risk along with updating building codes and increasing tree density in the hottest zones.
Not seeing the entire document below? Click here.


